
The Big Mac Index At 40

Welcome to the 166th Edition of the Geowizard Biweekly Global Business Update –
The Economist’s Big Mac Index turned 40 this year. Forty years, and it still works, for the same reason it always has. One product, sold almost everywhere in the world, priced in local currency gives businesspeople a fast, honest gut-check on whether a currency is over or undervalued, without waiting on a bank’s model or a government’s spreadsheet. I’ve leaned on it since 1990 as a first-pass sanity check, not a final answer. This milestone is a good reminder of why simple, consistent tools outlast the sophisticated ones.
That same instinct - looking past the headline number - is exactly what this quarter’s U.S. GDP growth report demands. The 1.5% growth figure for Q2 is real, but it’s hiding a much more uneven quarter underneath: consumer spending surged to a 3.2% pace and, on its own, contributed more than the entire net growth number. Investment held up well too. Both got mostly offset by a widening trade gap, a pullback in government spending, and businesses drawing down inventory they’d built up in Q1. Read the headline alone and you’d miss the real story.
And in a special report entitled, “The Divergence Nobody Planned” we address that China’s share of American and European imports moved as a single line for eighteen years. In 2025, it split into two. This is a policy story, not an economic one, and one every company sourcing or expanding on both sides of the Atlantic needs to understand.
Plus: Every Country in the World by Income Group, The global balance sheet 2026, Big Tech AI spending spree tops US$1tn, the Vistage CEO Economic Outlook, The world’s balance-sheet is out of kilter with its economy, How China Went From Dream Customer to a Nightmare for Big Oil, How Mexico became a surprise cornerstone of America’s AI boom, the USMCA negotiation status, Where the iPhone Costs the Most in 2026, The restaurant business is changing beyond recognition and more!
The book review for this edition is “AI for Good: How Real People Are Using Artificial Intelligence to Fix Things That Matter” by Josh Tyrangiel. Artificial intelligence has generated no shortage of bold predictions from utopian promises to existential warnings. In AI for Good, journalist Josh Tyrangiel takes a refreshingly different approach. Rather than focusing on Silicon Valley visionaries or speculative futures, he tells the stories of people already using AI to solve practical problems in healthcare, education, public services, logistics and scientific research.
Global Franchise & Brand Sector News: Chili’s®, Chipotle®, Dominos®, KFC® and Mixue®
Paid subscribers to the Geowizard Substack biweekly global business update newsletter have access to all the content listed above… and much more.
The mission of this newsletter, started in March 2020 during the COVID business slowdown, is to use trusted global and regional information sources plus our global network to update our subscribers on key global and local trends that can impact the success of their businesses at home and abroad. We do not get involved with or report on politics!
This newsletter has been assembled, edited and curated by William (Bill) Edwards who has more than five decades of experience helping companies enter and scale in international markets. He has guided over 50 brands across multiple sectors into more than 35 countries. Bill’s experience includes living and working in 7 countries, and leading projects across more than 50 countries worldwide. Contact Bill with questions, comments and contributions. Bedwards@edwardsglobal.com, +1 949 375 1896
Please note that to create this newsletter we subscribe to almost 40 international information sources. The live links in each section may take the reader to a paid webpage.
First, A Few Words of Wisdom From Others For These Times
“Trade is like water. You put an obstacle in its way, and it finds another path.”, Kristalina Georgieva, Managing Director, IMF
“Only the paranoid survive.”, Andy Grove (Intel)
“In today’s world, global business success belongs less to the companies that predict the future than to those that prepare for multiple futures.”, Bill Edwards, your Editor
Interesting Data, Articles and Studies
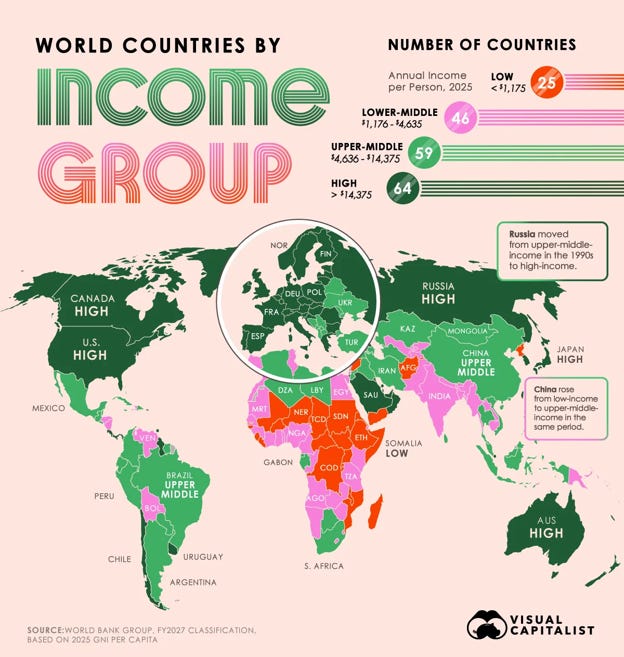
“Every Country in the World by Income Group - China has moved from low income to upper-middle income over recent decades, while Russia is once again classified as a high-income economy. Of the countries analyzed, 64 are classified as high income, 59 as upper-middle income, 46 as lower-middle income, and 25 as low income. The World Bank classifies economies using gross national income (GNI) per capita, with the high-income threshold set above $14,375 for fiscal year 2027. This map shows how the World Bank classifies countries into four groups based on gross national income per capita. The World Bank calculates GNI per capita using its Atlas method, which converts local currencies into U.S. dollars while smoothing some short-term exchange-rate fluctuations.”, Visual Capitalist & the World Bank, July 28, 2026
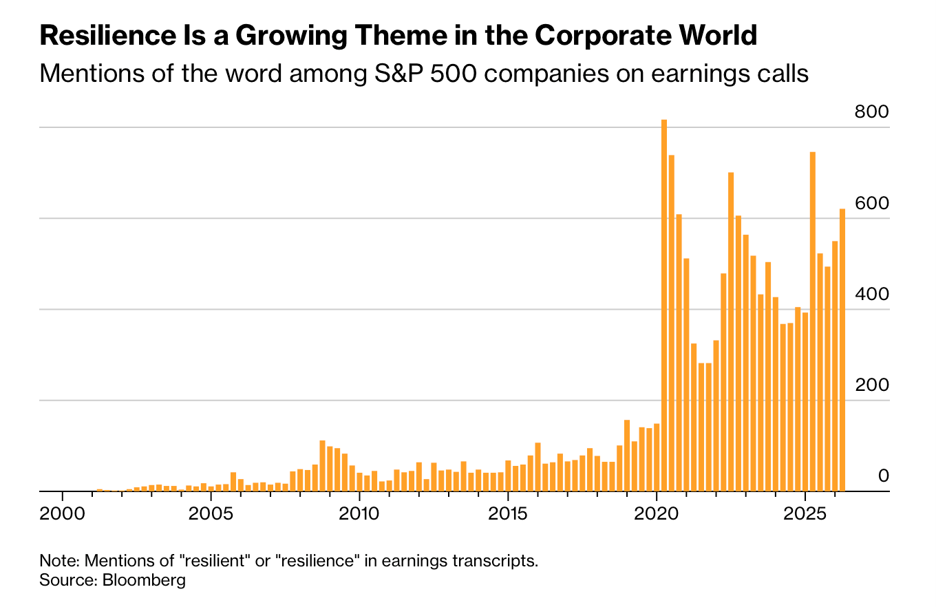
“We Are Living in an Era of Resilience. That’s Not Good - From the economy to climate change, our growing celebration of resilience says less about our strength than about a world we increasingly expect to be unstable. Economists, central bankers and chief executive officers now point to the resilience of consumers, supply chains and entire economies to argue that profits and growth can remain strong despite tariffs, shifting immigration policy, wars and energy shocks. Investors put their faith in the resilience of a bull market that makes plenty of people nervous. Scientists call for housing and infrastructure resilient enough to withstand climate change. Demographers contemplate the resilience of societies facing collapsing birth rates. Political scientists and historians debate the resilience of democracy itself. For economists, resilience has become a hot area of research and has yielded some fascinating papers. Yet it should worry us that our smartest minds are invoking more existential dread than we are used to — and pondering the consequences.”, Bloomberg, July 24, 2026
Editor’s Note: Bloomberg mistakes resilience for a symptom of dread. After five decades doing business in dozens of countries, I’d call it the opposite: the one skill that’s actually reliable. Nothing about global business has ever been stable as currencies, tariffs, governments, ports, weather all move constantly, in every decade I’ve worked in. Waiting for calm before building resilience means never building it. Companies that plan for change, not around it, are the ones still standing when a market shifts. Resilience isn’t existential dread dressed up as strategy. It’s what lets you enter a new country at all, dread or no dread.
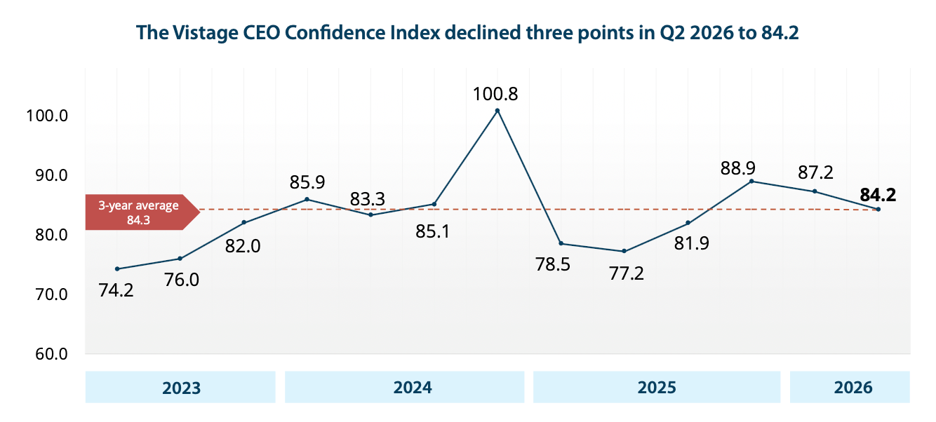
“Q2 2026 Vistage CEO Confidence Index Analysis - Recovering from a shocking black swan event like the pandemic took time, and the result has created a new normal that is resetting the status quo. The Q2 2026 Vistage CEO Confidence Index declined 3 points to reach 84.2, hovering right at the 3-year average of 84.3. CEO sentiment, as reflected by the Index, has recalibrated from the pre-COVID growth decade of the 2010s, when the Index averaged 97.8. Moving forward, this new baseline will shape how confidence and growth are measured until we enter the 2030s. Inside the Q2 Confidence Index response data, CEO expectations for future revenue and profit growth, along with plans for increased investments and headcount, have remained stable when compared to the prior quarter. It is CEOs’ sentiment on economic conditions today, compared to a year ago, which has plunged and driven the Index’s decline from last quarter.”, Vistage, July 2026
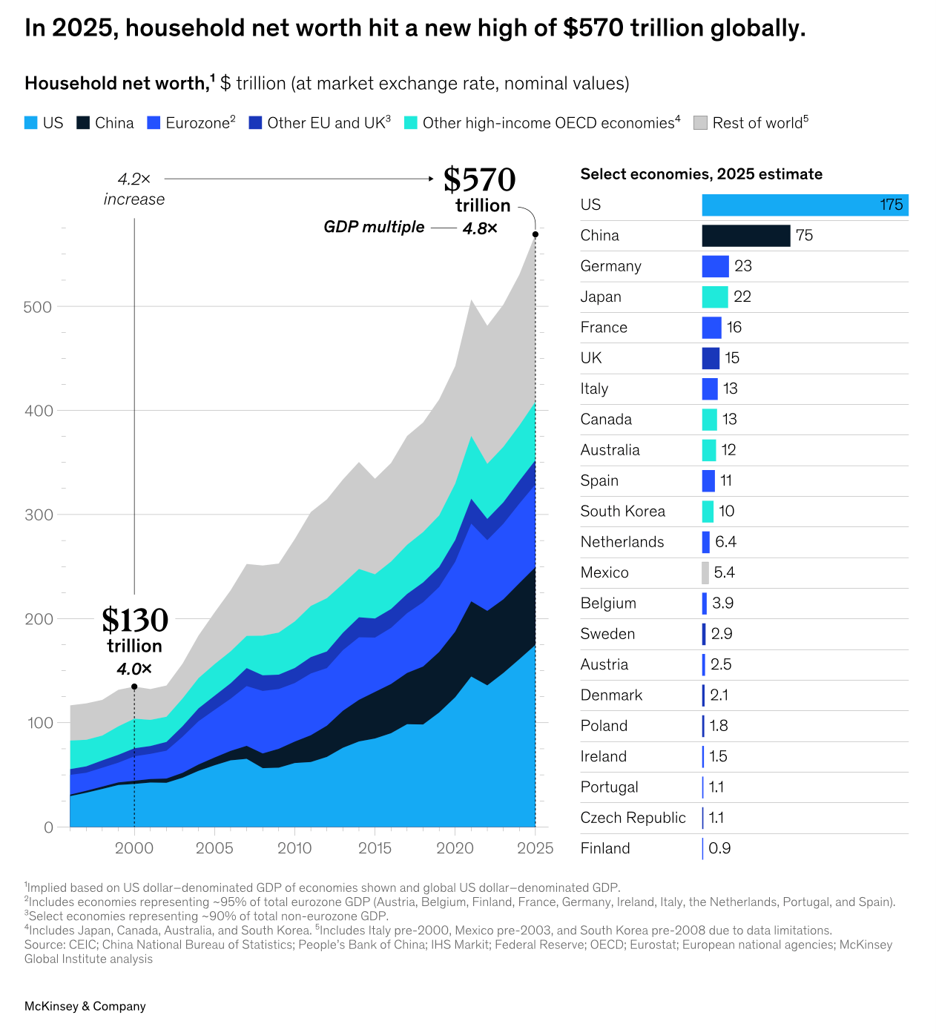
“The global balance sheet 2026: Imbalance and divergence - As of 2025, global household wealth totaled a record $570 trillion, up $40 trillion from 2024. That was more than quadruple its value in 2000, at nominal values and market exchange rates. This wealth grew faster than GDP, posing questions about its health and stability (see sidebar “When is wealth growth ‘healthy’?”). The United States continues to hold the largest share, at 30 percent. The eurozone and China held the next-largest shares, at 14 and 13 percent, respectively. At the country level, Poland, Ireland, Spain, and Sweden experienced the highest rates of household wealth growth (in dollar terms), each reaching double digits. Eurozone countries including Austria, France, Germany, Italy, and Portugal saw wealth grow slightly in dollar terms but decline in constant foreign-exchange terms as the dollar fell against the euro from 2024 to 2025.”, McKinsey & Co., July 123, 2026
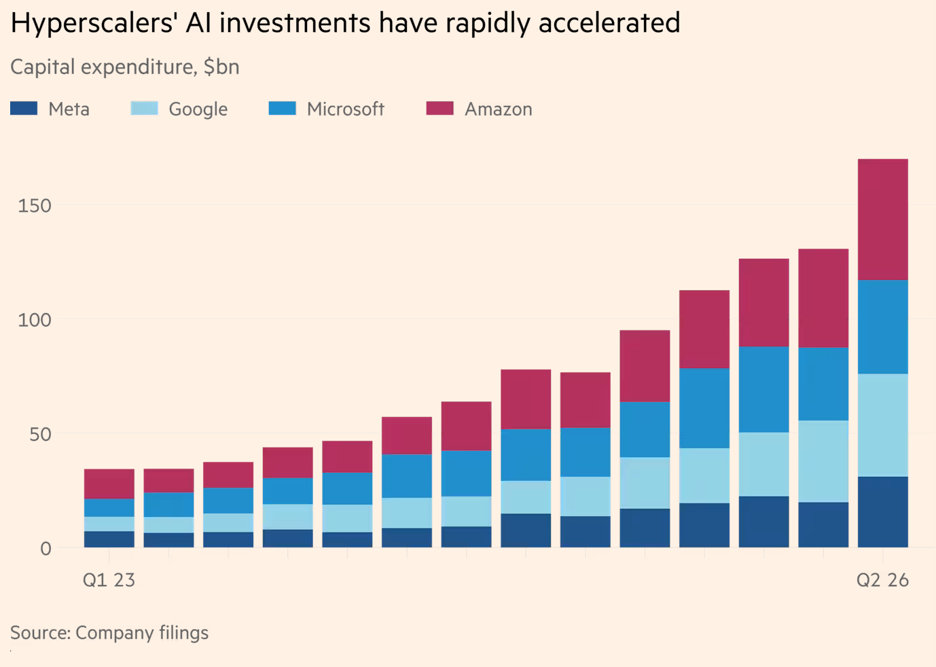
“Big Tech AI spending spree tops US$1tn - Google, Amazon, Microsoft and Meta have vastly increased their investments since the AI boom began in 2023. Combined capital spending by Google, Amazon, Microsoft and Meta from the beginning of the AI boom in 2023 to the end of June hit $1.1tn, according to earnings reports from the four companies in the past two weeks. The four companies combined plan to spend $745bn on capex, mainly data centres, advanced chips and the power to run them this year, after both Google and Amazon increased their projections this quarter.” The Financial Times, July 30, 2026
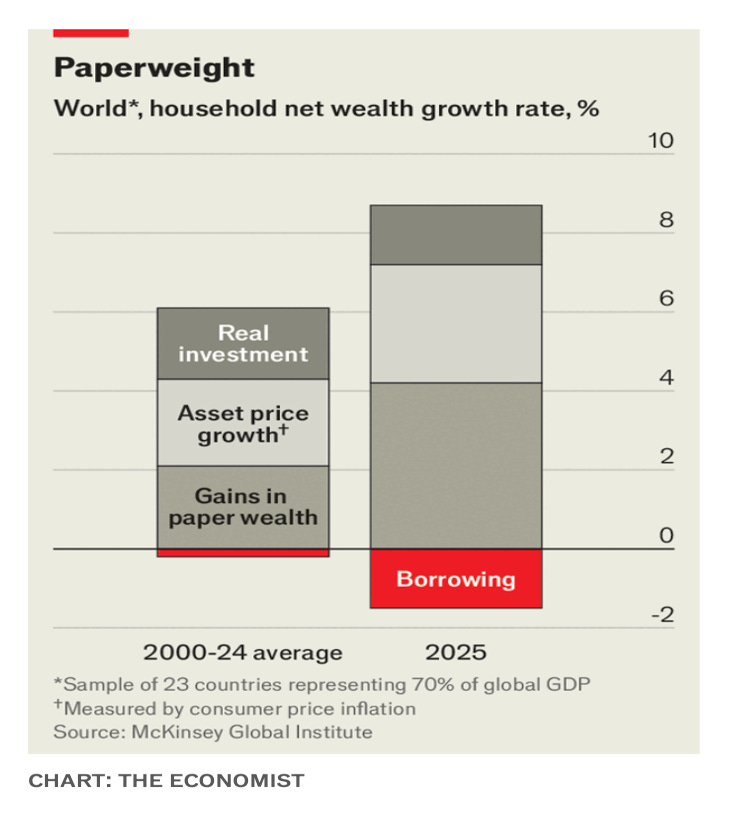
“The world’s balance-sheet is out of kilter with its economy - Restoring balance could be painful. How rich is the world economy? The conventional answer is about $120trn. That corresponds to global gdp, encompassing all the goods and services the world produced last year. It is, if you like, the planet’s annual income. Since 2021, the McKinsey Global Institute, a think-tank within a consultancy, has tried to track all the assets and liabilities on the world’s balance-sheet, real and otherwise. mgi’s latest estimate, published on July 23rd, is that the world’s wealth amounted to over $600trn in 2025, 5.1 times its annual income. mgi argues that the world’s balance-sheet is now “out of kilter” with the underlying economy. Balance could be restored by faster gdp growth or higher inflation. But two other scenarios are possible. Asset prices could stay high because people are determined to save rather than spend, resulting in low interest rates, high valuations and lacklustre growth. Or share prices could tumble, erasing paper wealth. Rise or fall, equities always net to zero at the global level.”, The Economist, July 23, 2026
Global Supply Chain, Energy, Commodities, Inflation, Taxes, Tariffs & Trade Issues
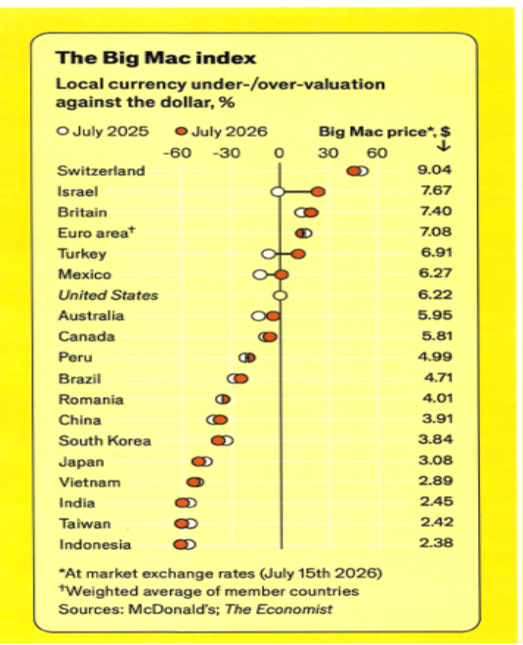
“The Big Mac Index At 40 - Currencies have risen and fallen, come and gone and are still mispriced. The difference in the dollar price of a (Big Mac) burger in Switzerland ($9.04) and Taiwan ($2.42) reveals something interesting about currencies. This thought struck Pam Woodall, our former economics editor, soon after she began writing for us 40 years ago. It was, she says, a ‘bathtub moment’. The Big Mac has been our muse ever since. The value of a currency should reflect its purchasing power, its command over goods and services. Rather than window shop for thousands of goods, we collect prices on just one: the Big Mac. It is available almost everywhere and tastes much the same. So why does a Big Mac cost so much more in some countries than in others? Many factors could be at play: tariffs, transport costs, lack of competition. In some countries the Big Mac is a familiar comfort food. In others, it is an exotic treat. The Big Mac contains over 60 ingredients. Its price also reflects the cost of labour, rent and electricity. In Switzerland strict food rules and animal-safety laws keep farms small. Beef can cost 2.7 times as much as it does in Taiwan…..in America, a single Big Mac can be bought for (US)$6.22. If a currency is worth less in the markets than Big Mac prices would warrant, our index deems it undervalued. If it is worth more, we consider it overvalued.”, The Economist, July 30, 2026
Editor’s Note: For the 36 years that I have been looking for ways to compare one country to another the Big Mac Index has always been there as a first-pass sanity check, not a final answer. A simple, consistent, and never out of print way of quickly comparing counties as places to do business.
“One of the Busiest Shipping Ports Wants to Go Nuclear - The Port of Long Beach considers construction of a reactor to meet a growing need for electricity. The Port of Long Beach this week signed an agreement with federal regulators to explore the construction of a small nuclear reactor to power the energy-hungry port. It is among the most significant steps forward so far in the Trump administration’s push to bring nuclear power to the shipping industry. The plan is still in the early stages and may not come to fruition, but if it does, it could make the port the first in the world to run on nuclear power. Long Beach has a total of 22 ship terminals, and officials estimate that the electricity bill for each terminal averages $420,000 a month. The port has been looking for cleaner and cheaper electricity sources for decades, a search that has taken on more urgency as it begins a push to electrify cargo-handling equipment and other operations that currently burn fossil fuels. The chief executive of the port, Noel Hacegaba, said it would work with the Maritime Administration, the Coast Guard and other federal agencies to develop safety and operational standards for the use of nuclear power in maritime settings, including on commercial vessels.”, The Wall Street Journal, July 23, 2026
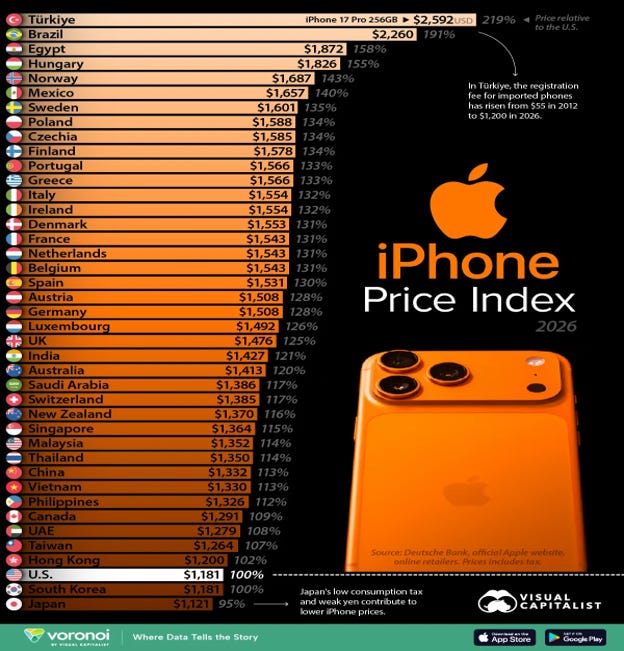
“Where the iPhone Costs the Most in 2026 - Apple sells the same flagship smartphone worldwide, but its retail price varies significantly by market. This graphic compares the price of Apple’s iPhone 17 Pro (256GB) across 41 markets in 2026 using data from Deutsche Bank. Türkiye is the world’s most expensive place to buy an iPhone 17 Pro (256GB), with a retail price of $2,592. The same model costs more than twice as much in Türkiye as it does in Japan, the cheapest market in the comparison. Taxes, import duties, currency movements, and local regulations can add hundreds of dollars to an iPhone’s retail price. At the other end of the ranking, Japan has the lowest price in the comparison at $1,121, slightly below U.S. pricing. The wide gap shows how taxes, import policies, and local market conditions can outweigh the global pricing strategy of one of the world’s leading smartphone brands.”, Visual Capitalist & Deutsche Bank, August 1, 2026
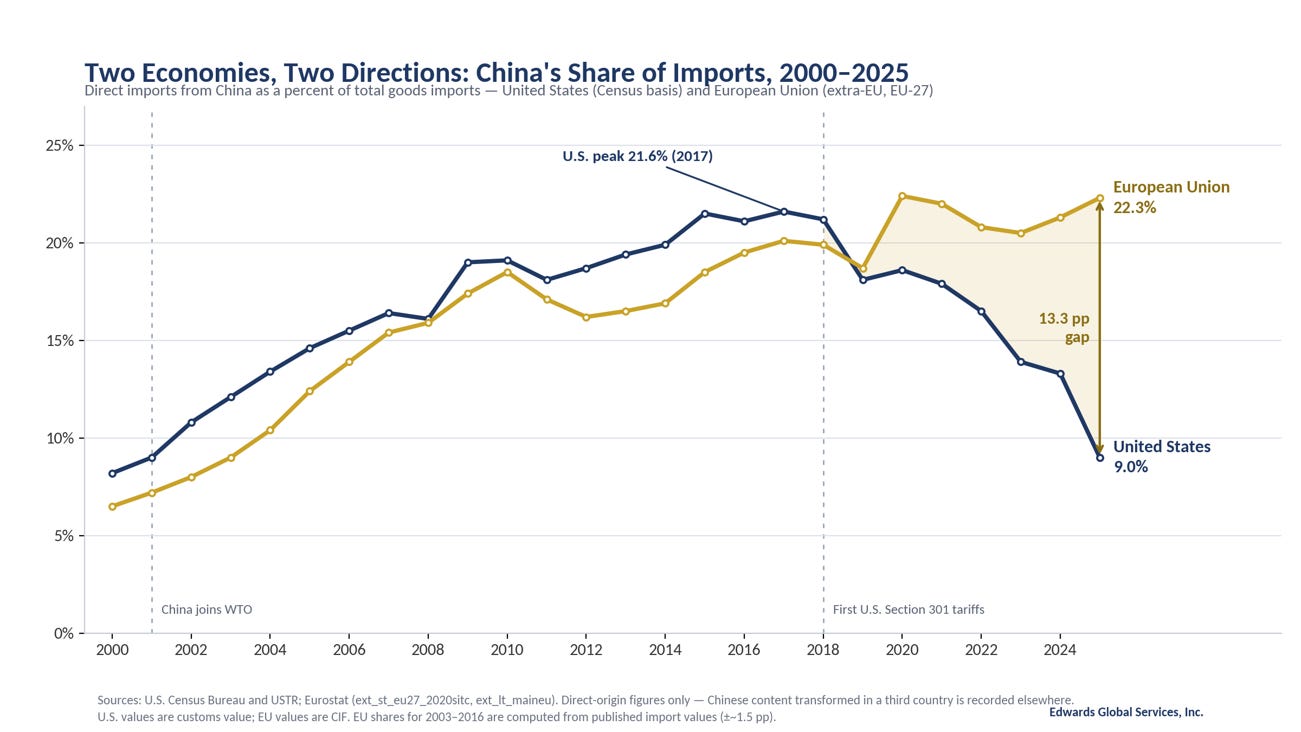
The Divergence Nobody Planned - China’s share of American and European imports spent eighteen years moving as one line. In 2025 it became two.
China’s share of American and European imports moved as one line for eighteen years. In 2025, it became two, and the reason is policy, not economics. Washington has tariffed Chinese goods continuously since 2018 and dramatically widened those measures in 2025. Brussels has applied almost nothing comparable, beyond targeted duties on Chinese electric vehicles adopted in late 2024. That single divergence in policy is what broke eighteen years of near-identical behavior apart.
From 2000 to 2017, the U.S. and EU built the same relationship with China at the same speed. The U.S. share of goods imports from China climbed from 8.2% to a peak of 21.6%; the EU’s share of extra-EU imports climbed from roughly 6.5% to about 20%. For eighteen years the two lines never separated by more than two or three points.
Then the U.S. line broke, in two stages. The first Section 301 tariffs of 2018 ended the American climb at that 21.6% peak. What followed was a steady grind, not a collapse: down to 13.3% by 2024, as manufacturers quietly moved final assembly to Mexico, Vietnam and the wider ASEAN bloc. Then 2025 hit differently, in kind rather than degree. U.S. goods imports from China fell 29.7% in a single year, to $308.4 billion, even as total U.S. imports set a record at $3.44 trillion. China’s share landed at roughly 9%, the lowest since 2001. In eight years, the American number more than halved, and nearly half of that entire decline happened in 2025 alone.
Europe’s line never broke at all. Its share is measured against total extra-EU imports, and Europe’s import bill is dominated by energy in a way America’s is not, so its China share swings with oil and gas prices rather than sourcing decisions, a €610 billion move in the energy denominator over four years. Strip that noise out and European dependence on Chinese manufactured goods has risen almost without interruption for 25 years. In 2025, while the U.S. number collapsed, EU imports from China actually rose 6.4%, to €559.4 billion. European “de-risking” remains a rhetorical program; it does not yet appear in the trade data.
Two caveats cut the American number down further: transshipment through Vietnam and Mexico hides real Chinese content and declared import values fell roughly a third faster than actual volume, meaning some of the 29.7% drop is paperwork, not sourcing change.
For companies sourcing or expanding in both markets: the U.S. risk is tariff and rules-of-origin exposure on real and unsettled legal questions. The EU risk is concentration, a record China share sitting in a policy environment that hasn’t acted on it yet.
Sources
Office of the U.S. Trade Representative, “The People’s Republic of China” country page — 2025 U.S. goods trade values with China.
U.S. Census Bureau, Foreign Trade Division, “Trade in Goods with China” (series c5700); Census/BEA, “U.S. International Trade in Goods and Services, December and Annual 2025.”
U.S. Bureau of Labor Statistics, Import/Export Price Indexes, “China: Price Movements of Top Imports” — 2017 U.S. share of 21.6%.
Eurostat, “Trade in goods with China in 2025” (ddn-20260410-2) and “EU trade in goods surplus down to €128 billion in 2025” (ddn-20260326-4) — 2025 EU values and 22.3% share.
Eurostat, “Slight decline in imports and exports from China in 2024” (ddn-20250304-1); “EU trade in goods with China: Less deficit in 2023” (ddn-20240304-2); EU–China Summit item (edn-20220401-1); “China: EU’s largest partner for imports” (ddn-20180522-1) — EU shares for 2024, 2023, 2021 and 2017.
Eurostat Statistics Explained, “International trade in goods” (2025 edition) — 2022 EU goods deficit of €434 billion driven by energy prices; 2023 import decline of 16.1%.
Eurostat (COMEXT), extra-EU imports of mineral fuels, lubricants and related materials — €221 billion (2020), €831 billion (2022), €470 billion (2024).
Eurostat Statistics Explained, “EU imports of energy products — latest developments”; “Shedding light on energy in Europe,” 2024 and 2025 editions.
Board of Governors of the Federal Reserve System, FEDS Notes, “As the U.S. is Derisking from China, Other Foreign U.S. Suppliers Are Relying More on Chinese Imports,” August 2, 2024.
Coalition for a Prosperous America, “Don’t Be Misled by the Falling Value of Chinese Imports,” June 2026.
Port of Los Angeles, annual “Facts and Figures” card, calendar year 2025 — top five foreign trade routes; Northeast Asia and Southeast Asia shares of cargo handled.
Transport Intelligence, November 2025, and Los Angeles Business Journal, June 2026 — East and Gulf Coast share of U.S. TEU volumes; San Pedro Bay import origin shares.
“Greer hopes to have ‘interim arrangement’ options for USMCA by end of year - U.S. Trade Representative Jamieson Greer told the Senate Finance Committee that he hopes to present President Trump and the leaders of Canada and Mexico with options by the end of 2026 for separate interim agreements to address key trade issues under the U.S.-Mexico-Canada Agreement (USMCA). Rather than waiting for a comprehensive renegotiation of the agreement, Greer suggested that targeted arrangements with each country could resolve pressing concerns while more complex issues continue to be negotiated.
The first six-year review of the USMCA officially began on July 1 after the United States notified Canada and Mexico that it would not automatically renew the agreement, triggering a formal review process. Greer indicated that difficult topics—including automotive rules of origin, labor and environmental provisions—will likely require additional discussions with Congress into next year.”, Inside Trade, July 23, 2026
